Academic Economics Chart Simulation
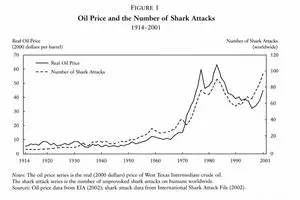
A prompt designed to generate highly realistic but fictitious academic charts, specifically showing a correlation between oil prices and shark attacks in an economics paper style.
Prompt text
Original English text. Replace placeholders with your own details.
Source & attribution
QC · Awesome GPT Image 2
Source-listed license: CC-BY-4.0. Prompt text is preserved; titles and previews may be shortened for display. Source examples are not NexGateHub test results.